Optimizing your ecommerce store to increase conversions starts with understanding how online shoppers use it. Otherwise, you won’t know what to improve in the first place.
The problem is that understanding how visitors use your ecommerce site in order to grow it requires research, and where to start, what to test, gathering participants and making arrangements can feel more like an avalanche than a to-do list.
It’s why we put together a UX research methods guide, and it’s why tools like Crazy Egg exist: to make understanding how users interact with your website simple (and, in Crazy Egg’s case, colorful).
As a marketing tool, Crazy Egg snapshots show you how potential customers use your website, so you know where to smooth out their experience to increase conversions.
But as with any tool, it helps to know how to use it.
In this article, we’ll review Crazy Egg’s main features (heatmaps, scroll maps, click reports, session recordings and A/B testing) with quick tips on how to start optimizing your website and marketing strategies for growth right away.
Use Heatmaps to Understand Users
Heatmaps reveal how website visitors behave on each page of your website by showing which areas get the most engagement. The map indicates high engagement areas with warmer colors (reds) and lower engagement areas with cool colors (blues).
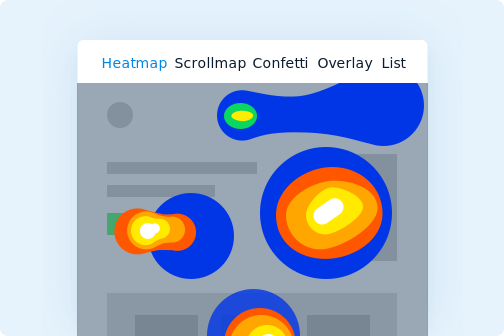
Image from Crazy Egg.
Crazy Egg allows you to filter heatmap results by the campaign (e.g., email marketing, advertisements) that brought users to your site to see how each audience behaves. You can use Google Analytics reports in conjunction with heatmaps for additional insight and to cross-check data.
Heatmaps are a great tool when you’re redesigning any page of your ecommerce website. Before changing the page, see how users engage with the current iteration to take advantage of its strengths and remove its weaknesses. You’ll get better results with fewer design iterations.
List Reports in Crazy Egg breakdown numerical page data by element. Refer to this data to differentiate well-performing elements that are close to each other on a heatmap or of similar color.
Quick Tips
Simplify designs
Remove unnecessary blue elements that don’t work and red elements that distract from more important elements.
Highlight critical information
Find any vital information that’s colored blue and move it to an area with more engagement, or test new copy to draw more attention to that information.
Improve information architecture
Organize elements in order of importance to users with page goals in mind.
Increase conversions
Update CTAs that aren’t pulling attention. You can try switching up copy, using design elements to help them stand out or moving them to a more seen location.
Focus your efforts
Combine your Google Analytics and Crazy Egg strategies. For instance, use Google flow reports to see what pages users Clickthrough and drop off on, and then pull reports for those pages in Crazy Egg to get more detailed information as to why.
Use Scroll Maps to Improve Ecommerce Landing Pages
Scroll maps show how users scroll on a page and are color-coded like heatmaps. You can see which sections users scroll past quickly and where they stop to explore. Lighter colored areas mean the user stayed on that section of a page for longer.

Image from Crazy Egg.
Use scroll maps to reveal which content visitors are interested in and to decide where to place the content you want visitors to see.
If reorganizing content based on a scroll map, A/B test the change in advance. Visitors’ interest in one area of a page may have been due to the content itself, and replacing it with other content won’t guarantee that the new content will garner as much interest.
Quick Tips
Get users below the fold
Check if people scroll past the fold. If they don’t, you may need to make your content more compelling or make it clear that there’s more to see.
Encourage content consumption
See how far people are willing to scroll. Condense where you can or write compelling headlines at drop-off points to get them further down the page.
Prioritize important content
If you have information or content that you want to promote, such as a benefit or sale, but it isn’t getting enough attention, consider moving it towards a more engaging location so that it gets seen.
Use Overlay Click Reports to Hone Marketing Strategies
Overlay is a click report that you can use to understand user navigation, desires and confusion.
Aptly named, Overlay provides an overlay of a web page where you can see everywhere users click on the page. Each element that users click comes with a mini-report that reveals how many clicks it got and by which audiences, so you know which elements receive the most and least attention.
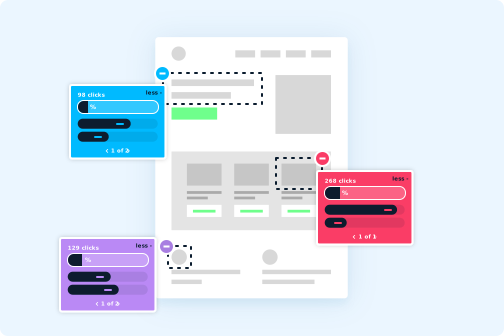
Image from Crazy Egg.
With this tool, you can filter through the clicks on your web page based on details like new vs. returning visitors, device and UTM campaign.
You’ll also be able to see where users attempted to select non-clickable elements, which is easy to miss when observing user behavior.
Quick Tips
Increase clicks where you want them
Whether it’s navigating to the right page or selecting a CTA, choose clickable elements that you’d like to receive more attention. A/B test changes to these elements, including new designs, placement or copy until clicks improve.
Reduce confusion and frustration
Take note of non-clickable elements that users are trying to click. If they are meant to be clickable, fix the error. If they’re not, make them appear less clickable, make related clickable elements look more clickable or make them clickable if it can help meet page goals.
Generate content ideas
Explore what links users click on in blogs and other content to find out what your audience is most interested in. You may also be able to gain ideas from the non-clickable elements users try to select.
Maximize campaign ROI
Filter click views to see which campaign audiences click through to the next step the most. Prioritize those investments and look into how to improve Clickthrough rates of other audiences. You can also compare your keywords by comparing the clicks of visitors who landed on your page after searching different keywords in Google.
Use Session Recordings to Shop With Your Customers
Session recordings are precisely what they say they are: recordings of how each user browses your website from the beginning to the end of their session. Data from recordings may not be as quick to consume, but it reveals site interactions from the user’s perspective, including mouse movements, scrolling, clicks and form engagement.
While Crazy Egg’s other tools may indicate issues with site functionality, recordings reveal exactly what’s up. You might discover a glitch you missed in testing, that users don’t know how to use a particular feature or that they struggle with navigation.
When comparing several recordings, you can discover patterns in how people use your site. This is another opportunity to look at data by audience to see how unique segments engage, allowing you to optimize your ecommerce store to each or learn where your investments are best spent. You can break audiences into segments like new vs. active users and users by source (e.g., Google Search).
Quick Tips
Evaluate your sales funnel
Use recordings to study site navigation and create user flows or customer journey maps. Assess how well users move through the steps in your ecommerce conversion funnel (e.g., product views, add to cart and transactions).
Make navigation straightforward
Track where visitors take more steps than necessary to find a product or complete a task and where they leave if they give up. Remove redundant and unhelpful steps to streamline the customer journey. You may also consider adding a search functionality if you don’t have one.
Discover friction areas that block conversion
Use Google Analytics data, overlays and recordings to discover negative behavior patterns and areas where users exit your website before converting. Then, watch how users interact with these areas in session recordings to determine what turned them away or down the wrong path. Fix or update these items to increase the number of people moving through your ecommerce conversion funnel.
Check for loading frustration points
Keep an eye out for points where the user has to wait, and make sure that your loading indicators give a sense of progress that makes the wait feel faster.
Evaluate your forms
Observe how users interact with your forms. Do they start them? Complete them? Are there areas where they hesitate? Do all form elements, including error messages, do their job?
Check your mobile-friendliness
Filter audiences to view recordings from mobile device users, and make sure that their experience is as seamless as desktop users’. Implementing mobile-friendly responsive design is critical in the digital era as there will be an estimated 187.5 million mobile buyers in the US by 2024.
Test Your Ideas With A/B Testing
Crazy Egg’s features include simplified A/B testing where you provide your testing variants, set your goal and map the desired user path to that goal. The tool splits audience views between variants and automatically gives the winning variant more traffic to prevent waste.
Quick Tips
Improve form and checkout completion
Consider web form design best practices. Create form variations with new designs, copy and fields to A/B test and increase submissions.
Test critical sales elements
Test new versions of significant guiding elements like CTA buttons and headers to keep growing Clickthrough rates.
Filter all updates inspired by Crazy Egg reports
Any changes you make to boost your ecommerce conversion rate, even if inspired by other report data, should be A/B tested with the current site. Doing this will ensure your changes make a positive difference.
Tangible Growth Comes From Data-Driven Decisions
It’s one of our core beliefs that an ecommerce website can look pretty all day, but unless it’s converting visitors, it’s a waste. While following best practices is a great place to start, not every practice is perfect for every ecommerce store and audience. Only data can say what works.
Another core belief? Things change, and growth is paramount. Continuing to optimize your website to meet audience expectations is the best way to increase the number of buyers moving down your sales funnel – and user data is the only way to know what your audience wants and how to give it to them in a way that sells.